6.3.1 Monitoring
6.3.2 Analysis
6.3.3 Tuning
6.3.4 Implementation
6.3.5 Storage of Capacity Management
data
6.3.6 Demand Management
6.3.7 Modelling
6.3.8 Application sizing
6.3.9 Production of the Capacity Plan
The activities described in this Section are undertaken when carrying out any of the sub-processes of Capacity Management and these activities can be done reactively or proactively.
The major difference between the sub-processes is in the data that is being monitored and collected, and the perspective from which it is analysed. For example the level of utilisation of individual components in the Infrastructure is of interest in Resource Capacity Management, while the transaction throughput rates and response times are of interest in Service Capacity Management. For Business Capacity Management, the transaction throughput rates for the on-line service need to be translated into business volumes, for example, in terms of sales invoices raised or orders taken.
A number of the activities need to be carried out iteratively and form a natural cycle as illustrated in Figure 6.6.
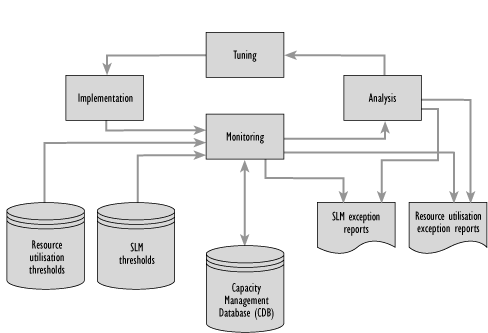
Figure 6.6 - Iterative activities in Capacity Management
Monitors should be established on all the components and for each of the services. The data should be analysed, using wherever possible, expert systems to compare usage levels against thresholds. The results of the analysis should be included in reports, and recommendations made as appropriate. Some form of control mechanism may then be put in place to act on the recommendations. This may take the form of balancing services, changing concurrency levels, and adding or removing resource. The cycle then begins again, monitoring any Changes made to ensure they have had a beneficial effect and collecting the data for the next day, week, or month.
Figure 6.7 - Activities in Capacity Management
Figure 6.7 shows the iterative activities as shown in Figure 6.6, together with the other activities of Capacity Management that need to be carried out:
Any one of the sub-processes of Capacity Management may carry out any of the activities, with the data that is generated being stored in the CDB. This Section describes all the activities of Capacity Management in detail and shows how the various sub-processes of Capacity Management use each of them as required.
![]()
It is important that the utilisation of each resource and service is monitored on an on-going basis to ensure the optimum use of the hardware and software resources, that all agreed service levels can be achieved, and that business volumes are as expected.
The monitors should be specific to particular operating systems, hardware configurations, applications, etc. Some of the monitors should be free utilities within a hardware or software product, while others form part of a larger systems management tool set and need to by purchased independently. It is important that the monitors can collect all the data required by the Capacity Management process, for a specific component or service.
Typical monitored data includes:
In considering the data that needs to be included, a distinction needs to be drawn between the data collected to monitor Capacity (e.g. throughput), and the data to monitor performance (e.g. response times). Data of both types is required by the Service and Resource Capacity Management sub-processes. The data should be gathered at total resource utilisation level and at a more detailed profile for the load that each service places on each particular resource. This needs to be carried out across the whole Infrastructure, host or server, the network, local server and client or workstation. Similarly the data needs to be collected for each service.
Part of the monitoring activity should be of thresholds and baselines or profiles of the normal operating levels. If these are exceeded, alarms should be raised and exception reports produced. These thresholds and baselines should have been determined from the analysis of previously recorded data, and can be set on:
All thresholds should be set below the level at which the resource is over-utilised, or below the targets in the SLAs. When the threshold is reached, there is still an opportunity to take corrective action before the SLA has been breached, or the resource has become over-utilised and there has been a period of poor performance.
| Hints and tips Many monitors do not report the whole picture, and beware of the monitor that requires so much resource that a processor or memory upgrade is required to get the monitor to run. |
Often it is more difficult to get the data on the current business volumes as required by the Business Capacity Management sub-process. These statistics may need to be derived from the data available to the Service and Resource Capacity Management sub-processes.
Many SLAs have User response times as one of the targets to be measured, but equally many organisations have great difficulty in supporting this requirement. User response times of IT and network services can be monitored and measured in several ways:
In some cases a combination of a number of systems may be used. The monitoring of response times is a complex process even if the service is an in-house service running on a private network. However if this is an external Internet service, the process is much more complex because of the sheer number of different organisations and technologies involved.
| Anecdote A private company with a major Internet web site implemented a web site monitoring service from an external supplier that would provide automatic alarms on the Availability and response time of their web site. The Availability and speed of the monitoring points were lower than those of the Internet web site being monitored. Therefore the figures produced by the service were of the Availability and response time of the monitoring service itself, rather than those of the monitored web site. |
| Hints and tips When implementing external monitoring services, ensure that the service levels and performance commitments of the monitoring service are in excess of those of the service(s) being monitored. |
![]()
The data collected from the monitoring should be analysed to identify trends from which the normal utilisation and service level, or baseline, can be established. By regular monitoring and comparison with this baseline, exception conditions in the utilisation of individual components or service thresholds can be defined, and breaches or near misses in the SLAs can be reported upon. Also the data can be used to predict future resource usage, or to monitor actual business growth against predicted growth.
Analysis of the data may identify issues such as:
The use of each resource and service needs to be considered over the short, medium and long term, and the minimum, maximum and average utilisation for these periods recorded. Typically, the short-term pattern covers the utilisation over a 24-hour period, while the medium term may cover a one-week to four-week period, and the long term, a year-long period. Over time the trend in the use of the resource by the various IT Services will become apparent.
It is important to understand the utilisation in each of these periods, so that Changes in the use of any service can be related to predicted Changes in the level of utilisation of individual resources. The ability to identify the specific hardware or software resource on which a particular IT Service depends, is improved greatly by an accurate, up-to-date and comprehensive CMDB.
When the utilisation of a particular resource is considered, it is important to understand both the total level of utilisation and the utilisation by individual services of the resource.
| Example If a processor that is 75% loaded during the peak hour is being used by two different services, A and B, it is important to know how much of the total 75% is being used by each service. Assuming the system overhead on the processor is 5%, the remaining 70% load, could be split evenly between the two services. If a change in either Service A or B is estimated to double its loading on the processor, then the processor would be overloaded. However if Service A uses 60% and Service B uses 10% of the processor, then the processor would be overloaded if Service A doubled its loading on the processor. But if Service B doubled its loading on the processor, then the processor would not necessarily be overloaded. |
![]()
The analysis of the monitored data may identify areas of the configuration that could be tuned to better utilise the system resource or improve the performance of the particular service.
Tuning techniques that are of assistance include:
Before implementing any of the recommendations arising from the tuning techniques, it may be appropriate to consider using one of the on-going, or ad hoc activities to test the validity of the recommendation. For example, 'Can Demand Management be used to avoid the need to carry out any tuning?' or 'Can the proposed Change be modelled to show its effectiveness before it is implemented?'
![]()
The objective of this activity is to introduce to the live operation service, any Changes that have been identified by the monitoring, analysis and tuning activities.
The implementation of any Changes arising from these activities must be undertaken through a strict, formal Change Management process. The impact of system tuning changes can have major implications on the Customers of the service. The impact and risk associated with these types of changes are likely to be greater than that of other different type of changes. Implementing the tuning Changes under formal Change Management procedures results in:
It is important that further monitoring takes place, so that the effects of the Change can be assessed. It may be necessary to make further Changes or to regress some of the original Changes.
![]()
The CDB is the cornerstone of a successful Capacity Management process. Data in the CDB is stored and used by all the sub-processes of Capacity Management because it is a repository that that holds a number of different types of data viz. business, service, technical, financial and utilisation data. However the CDB is unlikely to be a single database and probably exists in several physical locations.
The information in the CDB is used to form the basis of performance and Capacity Management reports that are to be delivered to management and technical personnel. Also the data is utilised to generate future Capacity forecasts and allow the Capacity Management to plan for future Capacity requirements.
Capacity and performance data from the necessary system components should be identified or extracted and delivered to a central location where a CDB is housed. Data from components that make up the service can then be combined for analysis and provision of technical and management reporting.
Each of the Capacity Management sub-processes generates and uses any of the types of data stored in the CDB. For example, the technical data relating to the limiting Capacity of a component part of the IT Infrastructure is identified and stored by the Resource Capacity Management sub-process. Then this sub-process uses the data item as the threshold at which alarms are raised and exception reports are produced by the monitoring activity. The same data item can be used by the Service Capacity Management sub-process to identify the point at which SLAs are likely to be breached, while the Business Capacity Management sub-process uses the data item together with the current level of utilisation of the component in deciding whether the component needs to be upgraded.
The full range of types of data in the CBD is:
To understand exactly what drives the Capacity and performance of an IT system it is essential to have quality business data. The future business plans of the organisation need to be considered, and the effects on the IT Services understood. The business data is used to forecast and validate how changes in business drivers affect the Capacity and performance of the system. Typically business data includes:
It is essential that the Capacity Management process considers at all times the effect that the IT Infrastructure has on the work of the User. To achieve this service-orientated approach to Capacity Management, service data should be stored within the Capacity Management Database. Typical service data are transaction response times that are consistent with the perceived level of service delivered to the User.
Another example of service data would be the times taken for batch jobs to be processed. In general the targets in the SLAs and SLRs provide the service data that the Capacity Management process needs to record and monitor. To ensure that the targets in the SLAs are achieved, SLM thresholds should be included, so that the monitoring activity can measure against these thresholds and raise exception reports. By setting the thresholds below or above the actual targets, action can be taken and a breach of the SLA targets avoided.
The Capacity Management process as well as the SLM process is interested in service data. This enables the IT provider to be more focused on the delivery of SLA-compliant services. To do this the service data should be correlated with technical and business data to forecast future breaches of service targets.
Most of the components in the IT Infrastructure have limitations on the level to which they should be utilised. Beyond this level of utilisation the resource will be over-utilised and the performance of the services using the resource will be impaired. For example the maximum recommended level of utilisation on a CPU could be 80%, or the utilisation of a shared Ethernet LAN segment should not exceed 40%.
Also components have various physical limitations beyond which greater connectivity or use is impossible. For example the maximum number of connections through a network gateway is 100, or a particular type of disk has a physical Capacity of 15Gb.
The technical limits and constraints on the individual components can be used by the monitoring activities as the thresholds at which alarms are raised and exception reports are produced. However care must be exercised when setting thresholds, because many thresholds are dependent on the work being run on the particular component.
The Capacity Management process requires financial data. For example, when proposing various scenarios in the Capacity Plan, the financial cost of the upgrades to the components of the IT Infrastructure, together with information about the current IT hardware budget must be known and included in the considerations. Financial data can be obtained from a number of sources, including:
Most of this data may be available from the Financial Management for IT Services process but Capacity Management needs to consider this information when managing the future business requirements.
Potentially there is a vast amount of utilisation data available. Ideally data is required that shows the current utilisation of all components of the IT Infrastructure, minute-by-minute, hour-by-hour, day-by-day etc. However after a period of time, for example one week, the minute-by-minute utilisation data will no longer be required. Similarly after one month, the previous month's hour-by-hour data is not required. However even one year later the average daily utilisation of each component, or service transaction throughput rate and average response times may be required.
So in the collection of the utilisation data, there need to be facilities to enable data to be consolidated or refined, so that data can be deleted as it becomes out-of-date.
The utilisation data needs to be recorded for each component and service, and examples of utilisation data are shown in Table 6.1
| Technology | Example metrics available for collection | ||
| Mainframe | CPU utilisation | Paging rates | I/Os per second |
| Application | No of transactions | Response times | |
| UNIX server | CPU utilisation | Memory utilisation | No of processes |
| Middleware | Average queue lengths | No of transactions serviced | |
| Network | Bandwidth utilisation | No of connections | Error rates |
| Database | Shared memory utilisation | No of queries per second | |
| PC Client | CPU utilisation | Memory utilisation | |
Table 6.1 - Example utilisation data
Capacity Management stores data that is relevant to the IT systems, services and the Customers. There are many hardware and software tools that monitor systems and store performance data across all technology types and Infrastructure components. Some are free utilities within a hardware product, while others form part of a larger systems management tool set. It is important that any tool is chosen based on the data requirements of the Capacity Management process to be implemented.
The aim of a CDB is to provide the relevant Capacity and performance information to the appropriate sub-processes of Capacity Management. In addition, these reports could be used by a number of the other Service Management processes. This information is provided through various reports.
For each Infrastructure component there should be a team of technical staff responsible for its control and management, and management staff who are responsible for the overall service. Reports must be produced to illustrate how the service and its constituent components are performing and how much of its maximum Capacity is being used.
Reports that show management and technical staff when the Capacity and performance of a particular component or service becomes unacceptable are also a required output from a CDB. Exceptions can be set for any component, service or measurement that is stored within a CDB. An example exception may be that CPU percentage utilisation for a particular server has breached 70 % for three consecutive hours, or that the hit rate from Users exceeded all expectations.
In particular, exception reports are of interest to the SLM process in determining whether the targets in SLAs have been breached. Also the Incident and Problem Management processes may be able to use the exception reports in the resolution of Incidents and Problems.
To ensure the IT Service Provider continues to provide the required service levels, the Capacity Management process must predict future growth. To do this, future component and service Capacity must be forecast. This can be done in a variety of ways depending on the technology used by the component. Changes to workloads by the development of new functionality must be considered alongside growth in workload that is driven by business growth. A simple example of a Capacity forecast is a correlation between a business driver and a component utilisation, e.g. CPU utilisation against the number of accounts supported by the company. Then this data can be correlated to find the effect that increased numbers of accounts will have on the utilisation of particular components of the configuration.
If the forecasts on future Capacity requirements identify a requirement for increased resource, this requirement needs to be input to the IT budget cycle.
![]()
The prime objective of Demand Management is to influence the demand for computing resource and the use of that resource.
This activity can be carried out as a short-term requirement because there is insufficient current Capacity to support the work being run, or, as a deliberate policy of IT management, to limit the required Capacity in the long term.
Short-term Demand Management may occur when there has been a partial failure of a critical resource in the IT Infrastructure. For example, if there has been a failure of part of the memory on a processor, it may not be possible to run the full range of services. However a limited subset of the services could be run. Capacity Management should be aware of the business priority of each of the services, know the resource requirements of each service (in this case, the amount of memory required to run the service) and then be able to identify which services can be run while there is a limited amount of memory available.
Long-term Demand Management may be required when it is difficult to cost-justify an expensive upgrade. For example, many processors are heavily utilised for only a few hours each day, typically between 10: 00 - 12:00 and 14:00 - 16:00. Within these periods, the processor may be over-loaded for only one or two hours. For the hours between 18:00 - 08:00 these processors are only very lightly loaded, and the resource is under-utilised. Is it possible to justify the cost of an upgrade to provide additional resource for only a few hours in 24 hours, or is possible to influence the demand and spread the requirement for resource across the 24 hours, thereby avoiding the need for the upgrade?
Demand Management needs to understand which services are utilising the resource and to what level, and needs to know the schedule of when they must be run. Then a decision can be make on whether it will be possible to influence the use of resource, and if so, which option is appropriate.
The influence on the services that are running could be exercised by:
Demand Management can be carried out as part of any one of the sub-processes of Capacity Management. However Demand Management must be carried out sensitively, without causing damage to the business Customers or to the reputation of the IT organisation. It is necessary to understand fully the requirements of the business and the demands on the IT Services, and to ensure that the Customers are kept informed of all the actions being taken.
![]()
A prime objective of Capacity Management is to predict the behaviour of IT Services under a given volume and variety of work. Modelling is an activity that can be used to beneficial effect in any of the sub-processes of Capacity Management.
The different types of modelling range from making estimates based on experience and current resource utilisation information, to pilot studies, prototypes and full scale benchmarks. The former is cheap and a reasonable approach for day-to-day small decisions, while the latter is expensive but may be advisable when implementing a large new project.
Trend analysis can be done on the resource utilisation and service performance information that has been collected by the Service and Resource Capacity Management sub-processes. The data can be held in a spreadsheet and the graphical and trending, and forecasting facilities used to show the utilisation of a particular resource over a previous period of time, and how it can be expected to change in the future.
Typically trend analysis only provides estimates of future resource utilisation information. Trend analysis is less effective in producing an accurate estimate of response times in which case either analytical or simulation modelling should be used.
Analytical models are representations of the behaviour of computer systems using mathematical techniques, e.g. multi-class network queuing theory. Typically a model is built using a software package on a PC, by specifying within the package the components and structure of the configuration that needs to be modelled, and the utilisation of the components, e.g. CPU, memory and disks, by the various workloads or applications. When the model is run, the queuing theory is used to calculate the response times in the computer system. If the response times predicted by the model are sufficiently close to the response times recorded in real life, the model can be regarded as an accurate representation of the computer system.
The technique of analytical modelling requires less time and effort than simulation modelling, but typically it gives less accurate results. Also the model must be kept up-to-date. However if the results are within 5% accuracy for utilisation and 15 - 20% for on-line application response times, the results are usually satisfactory.
Simulation involves the modelling of discrete events, e.g. transaction arrival rates, against a given hardware configuration. This type of modelling can be very accurate in sizing new applications or predicting the effects of Changes on existing applications, but can also be very time-consuming and therefore costly.
When simulating transaction arrival rates, have a number of staff enter a series of transactions from prepared scripts, or use software to input the same scripted transactions with a random arrival rate. Either of these approaches takes time and effort to prepare and run. However it can be cost-justified for organisations with very large systems where the cost (millions of pounds) and the associated performance implications assume great importance.
The first stage in modelling is to create a baseline model that reflects accurately the performance that is being achieved. When this baseline model has been created, predictive modelling can be done, i.e. ask the 'what if?' questions that reflect planned Changes to the hardware and/or the volume/variety of workloads. If the baseline model is accurate, then the accuracy of the result of the predicted Changes can be trusted.
Effective Service and Resource Capacity Management together with modelling techniques enable Capacity Management to answer the 'What if' questions. 'What if the throughput of Service A doubles?' 'What if Service B is moved from the current processor onto a new processor - how will the response times in the two services be altered?'
![]()
Application sizing has a finite life-span. It is initiated at the Project Initiation stage for a new application or when there is a major Change of an existing application, and is completed when the application is accepted into the operational environment.
The primary objective of application sizing is to estimate the resource requirements to support a proposed application Change or new application, to ensure that it meets its required service levels. To achieve this application sizing has to be an integral part of the applications lifecycle.
During the initial systems analysis and design the required service levels must be specified. This enables the application development to employ the pertinent technologies and products, in order to achieve a design that meets the desired levels of service. It is much easier and less expensive to achieve the required service levels if the application design considers the required service levels at the very beginning of the application lifecycle, rather than at some later stage.
Other considerations in application sizing are the resilience aspects that it may be necessary to build into the design of the new application. Capacity Management is able to provide advice and guidance to the Availability Management process about the resources required to provide the required level of resilience.
The sizing of the application should be refined as the development process progresses. The use of modelling can be used within the application sizing process.
The SLRs of the planned application developments should not be considered in isolation. The resources to be utilised by the application are likely to be shared with other services and potential threats to existing SLA targets must be recognised and managed.
When purchasing software packages from external suppliers it is just as important to understand the resource requirements needed to support the application. Often it can be difficult to obtain this information from the suppliers, and it may vary, depending on throughput. Therefore, it is beneficial to identify similar Customers of the product and to gain an understanding of the resource implications from them. It may be pertinent to benchmark trial the product prior to purchase.
![]()
The prime objective is to produce a plan that documents the current levels of resource utilisation and service performance, and after consideration of the business strategy and plans, forecasts the future requirements for resource to support the IT Services that underpin the business activities. The plan should indicate clearly any assumptions made. It should also include any recommendations quantified in terms of resource required, cost, benefits, impact etc.
The production and update of a Capacity Plan should occur at pre-defined intervals. It is, essentially, an investment plan and should therefore be published annually, in line with the business or budget lifecycle, and completed before the start of negotiations on future budgets. A quarterly re-issue of the updated plan may be necessary to take into account changes in business plans, to report on the accuracy of forecasts and to make or refine recommendations.
The typical contents of a Capacity Plan are described in Annex 6B.
![]()
![]()
![]()